1. Anaconda, Jupyter Notebook, and Data-based Projects
Anaconda
For Python programming, a programming environment is needed where data analysis is performed. One of the most popular at the moment is the Anaconda environment, which is worth installing on your own computer. Anaconda includes, among other things:
- Python interpreter
- Libraries needed for data analysis (NumPy, pandas, etc.)
- Libraries needed for graphical presentation or visualization (matplotlib, seaborn, etc.)
- Libraries needed for machine learning models (scikit-learn, etc.)
- Jupyter Notebook for writing and executing programs
- ...and much more...
Anaconda can be installed on Windows, Mac, and Linux from: installation instructions
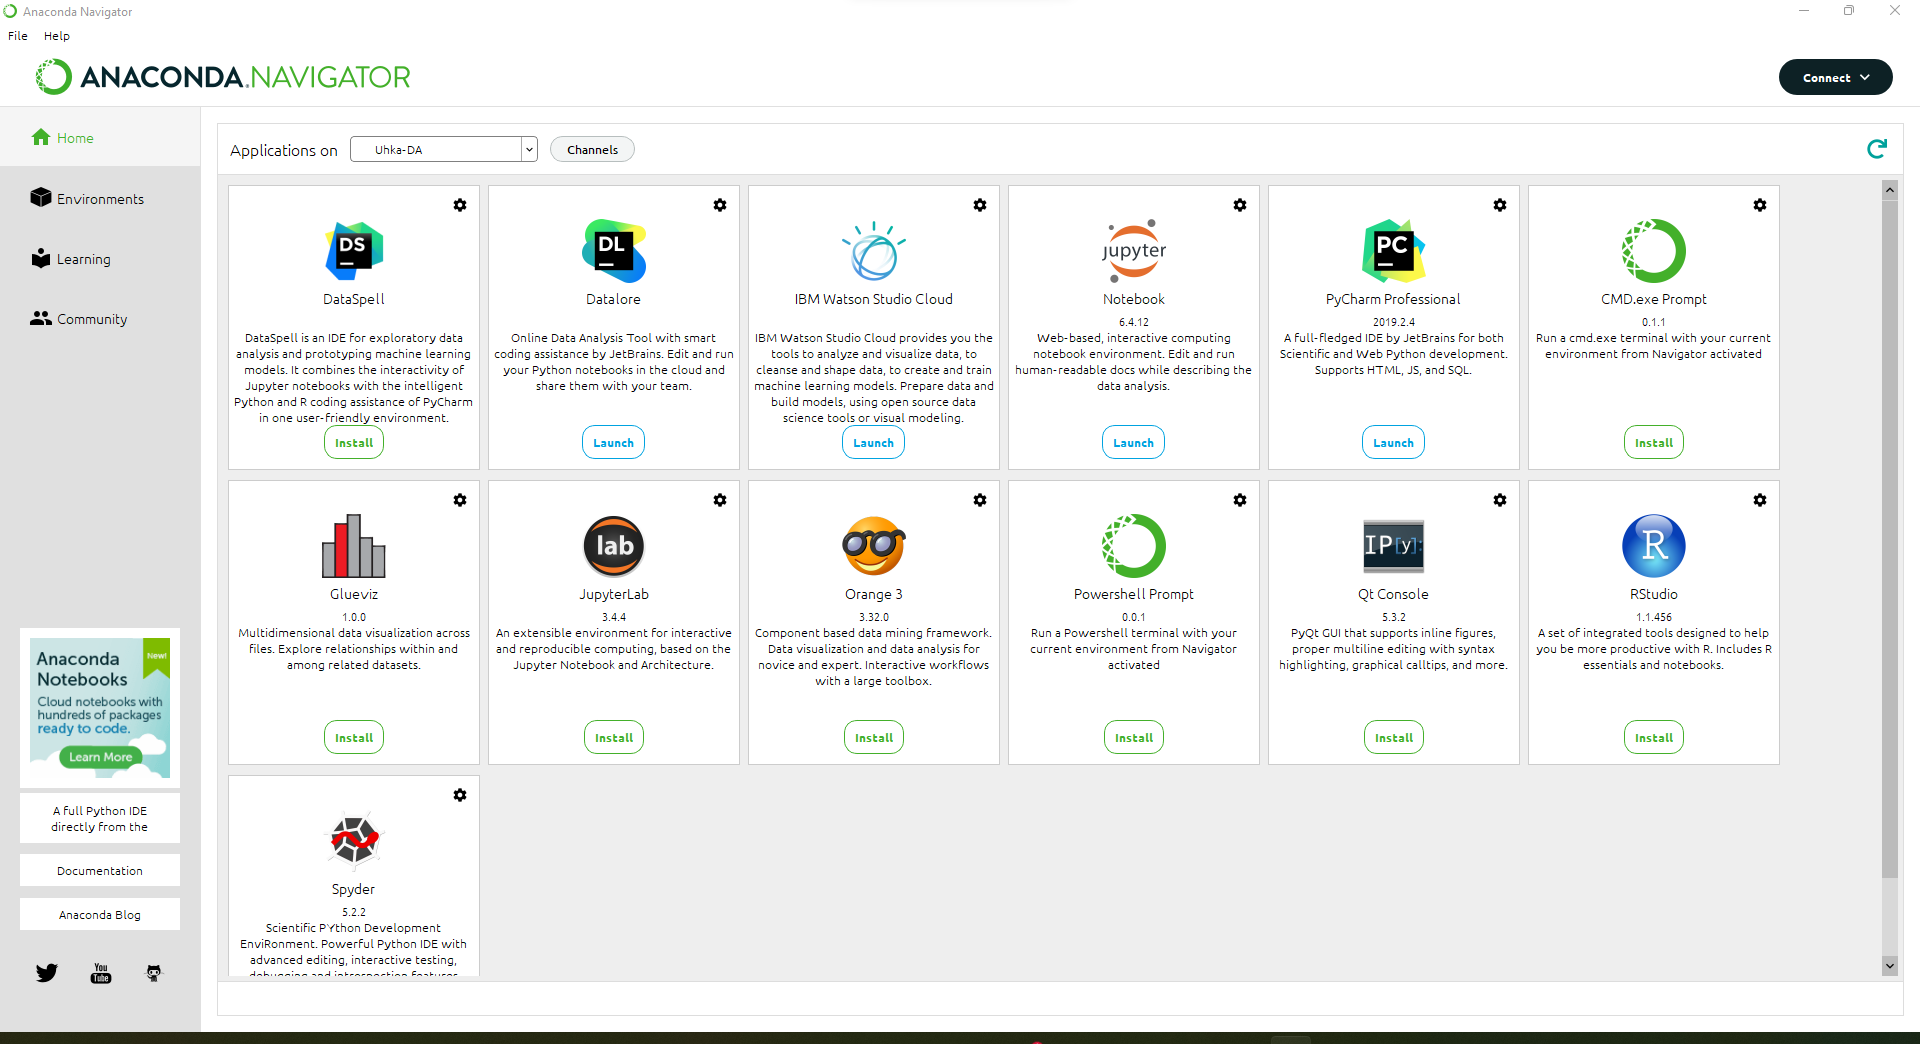
After selecting the operating system, the installation can be performed with the default settings. After installation, the Anaconda Navigator application can be launched.
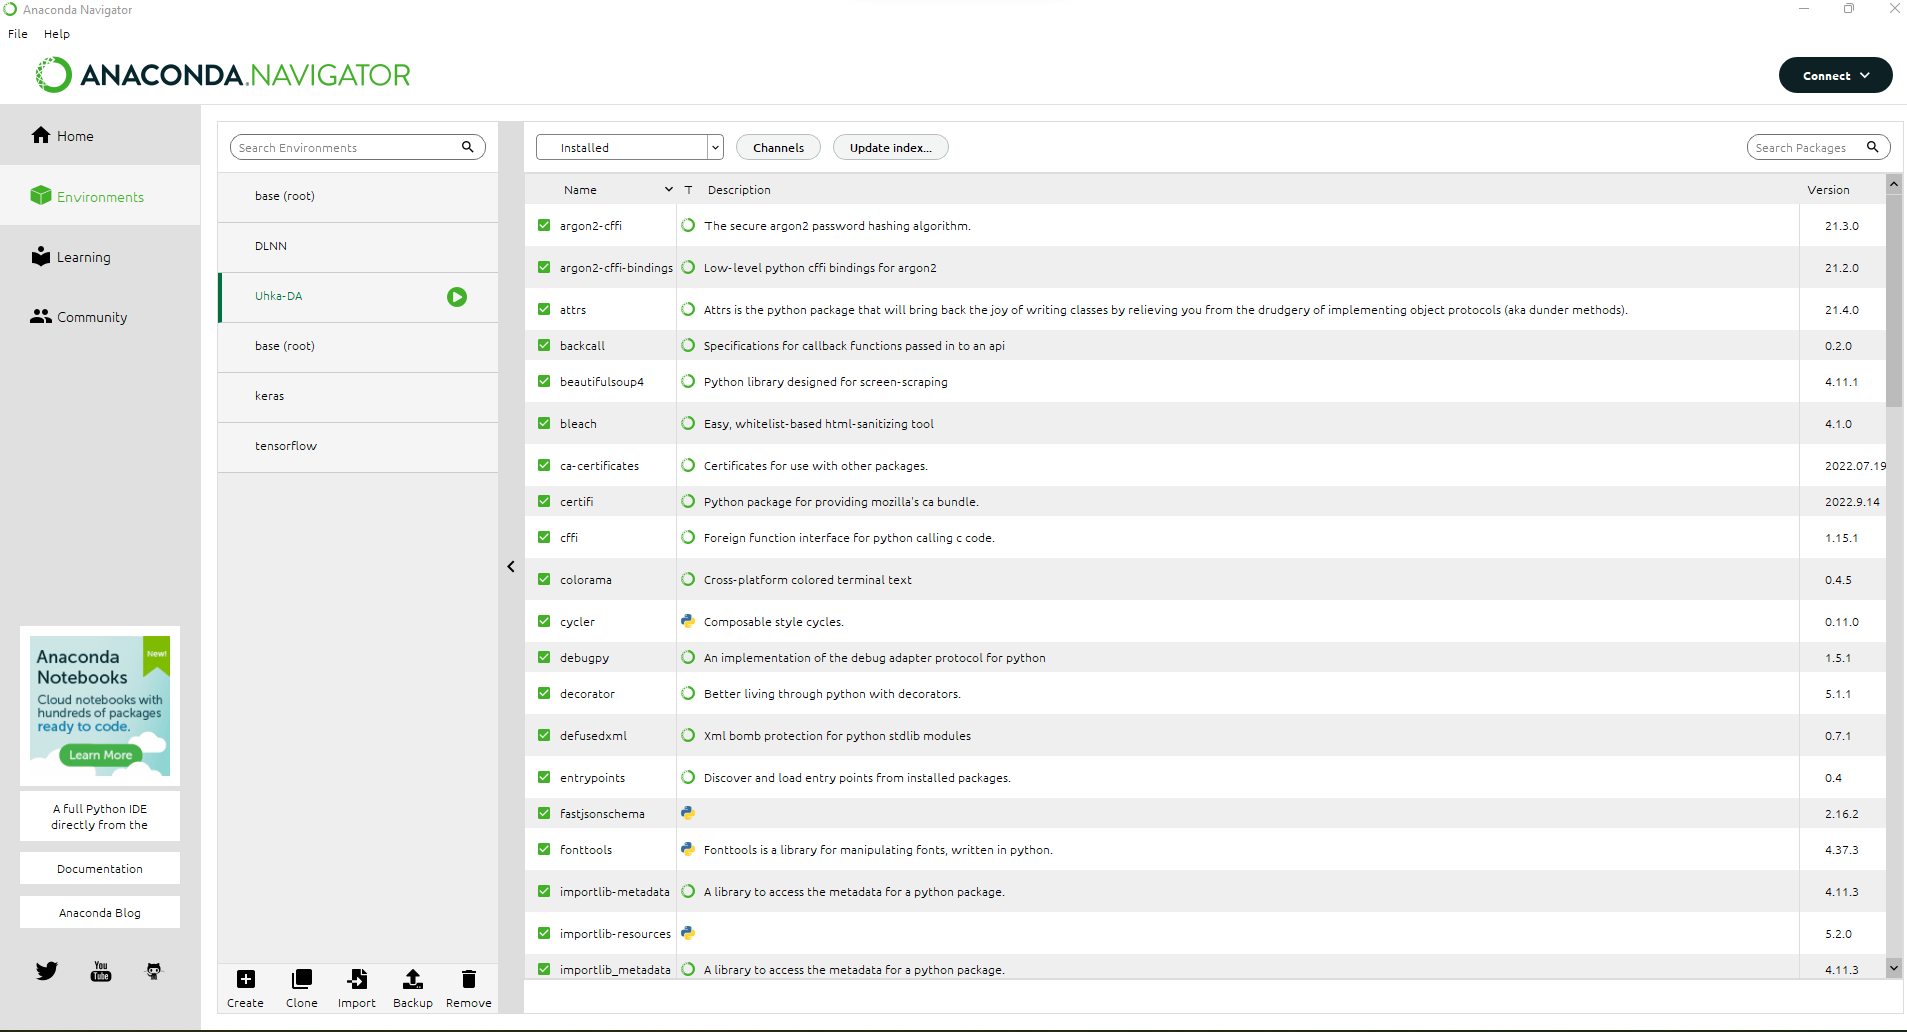
A good aspect of Anaconda Navigator is that you can safely update libraries to the latest versions so that the dependencies between the libraries work even after the update. Updating libraries becomes relevant if you want to use features added in newer versions. Library updates are done in the Environments section.
You can find instructions for using Anaconda at: Instructions
Jupyter Notebook
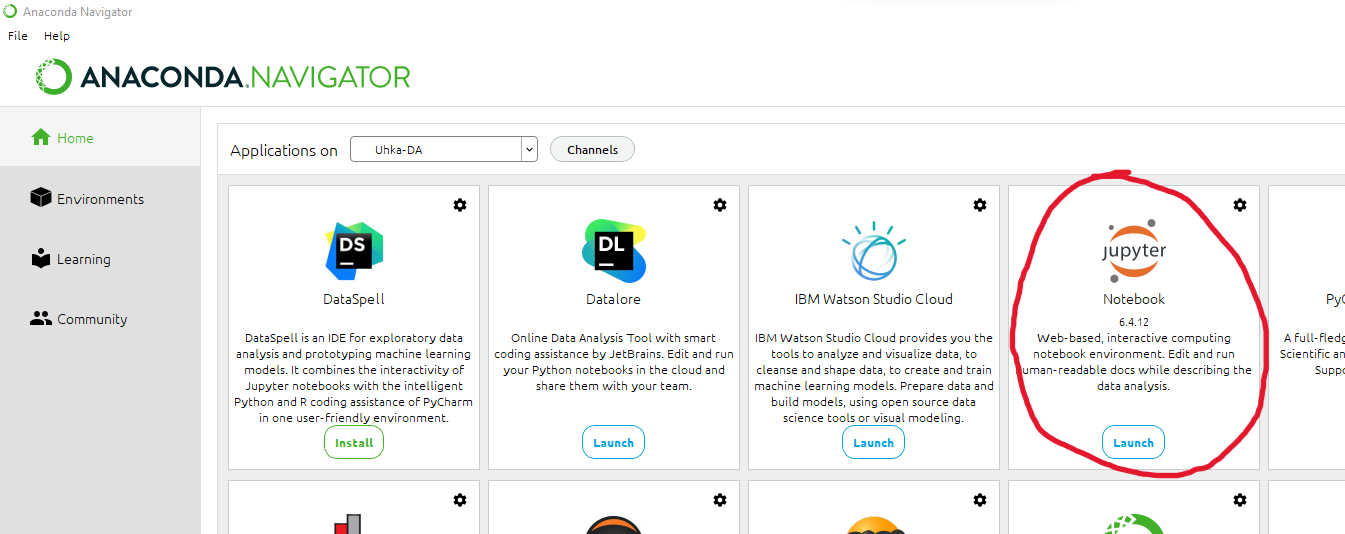
Jupyter Notebook is a great tool for writing and executing Python programs related to data analytics. Jupyter Notebook is installed along with Anaconda. Jupyter Notebook can be launched directly from the startup menu under Anaconda. If you wish, you can create its own icon on the desktop.
After starting, the Jupyter Notebook homepage opens in your default browser on a tab named Home:
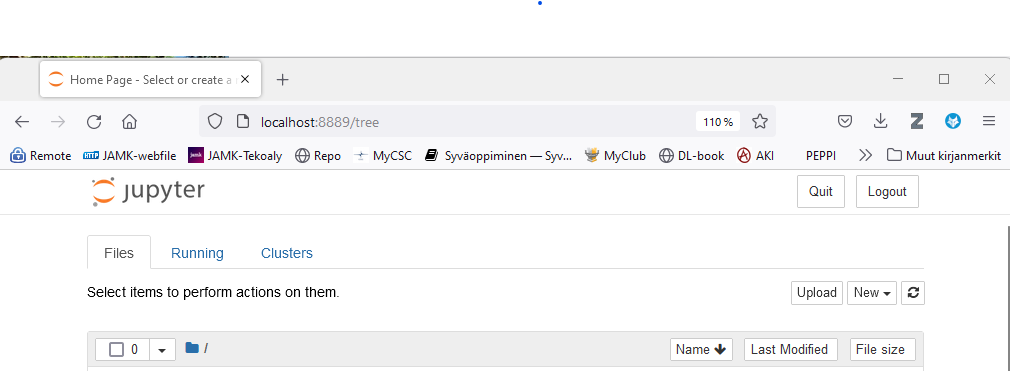
You can start writing Python code by selecting New -> Python 3 (ipykernel)
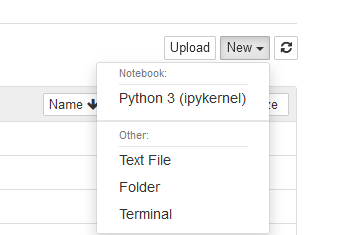
After which a new tab named Untitled - Jupyter Notebook opens in the browser
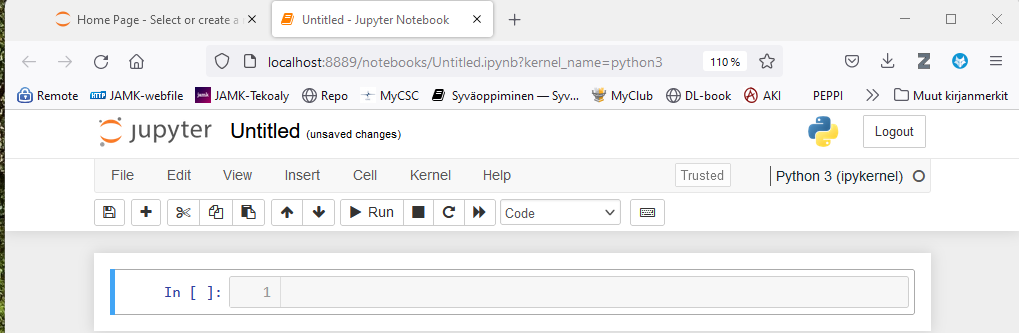
At the top of the Notebook, you will find toolbar buttons and menus, which are worth exploring.
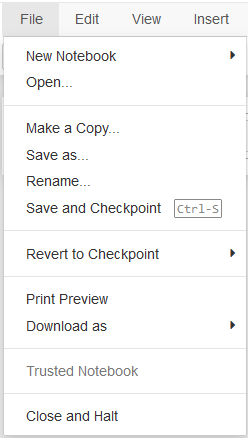
For example, from the File menu you can:
- Rename using the File menu's Rename function
- Save with a new/different name
- Download the notebook in different file types
- Make a copy of the notebook
- etc.
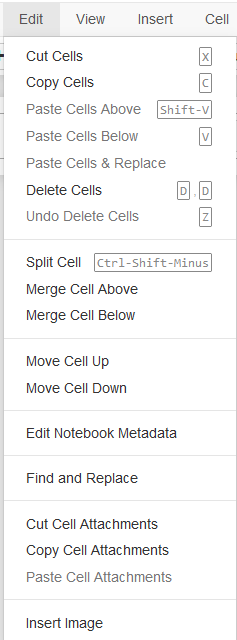
Similarly, the Edit menu looks like this:
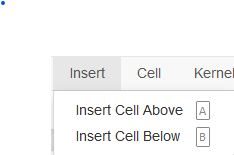
In the Insert menu, you can add cells before or after the activated cell if necessary:
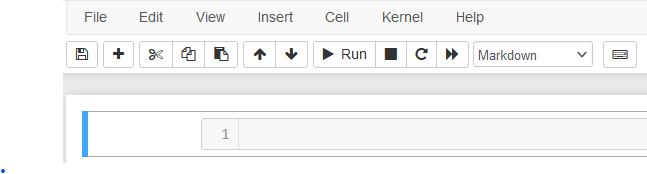
Each cell has a specific type, the most important being Markdown and Code:
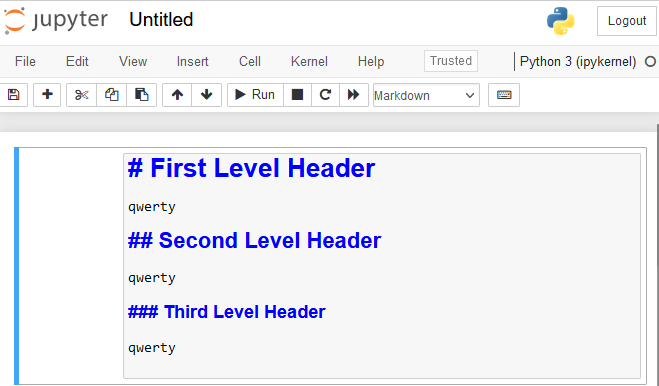
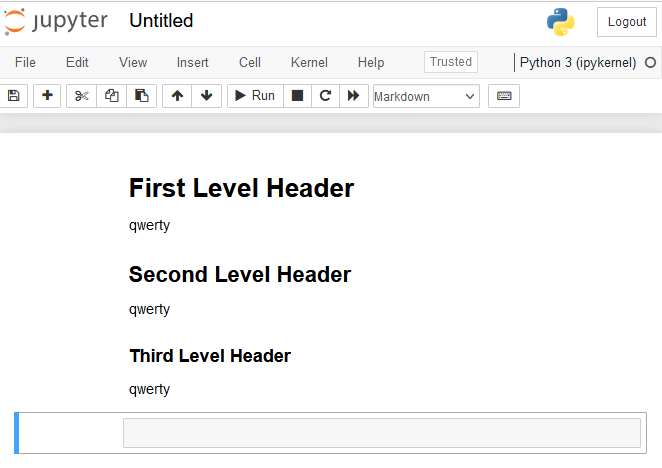
There are many tutorials on Markdown available on the internet, and section 2 contains a brief tutorial on writing Markdown. A Markdown cell is run with the Run button, which generates easier-to-read text.
When the cell type is Code, you can write code in Python. The code is also run with the Run button. In a Code cell, comments are made with the #-symbol.
The outputs and error messages following the execution of Python code, or actually a script, are printed below the cell. The code can be changed and executed again at any time. Variables and other information stored by previously executed code remain throughout the session, so part of the program can be executed in one cell and continued in another cell. If necessary, the information stored by the session can be cleared from the Kernel menu with the command Restart & Clear Output. Each notebook has its own kernel, and Restart & Clear Output only affects the active notebook. Notebooks are saved with the extension .ipynb (IPYthon NoteBook).
Python programs can, of course, be written and run in other ways, for example, by writing .py files with a text editor and running them from the command line. One example of a free Python IDE is PyCharm.
The use of Jupyter Notebook in data-driven projects is very common because it allows code to be commented on and explained with the help of Markdown. The documentation can be saved from the File->Download menu in formats such as html or pdf.
Data-driven project and its phases
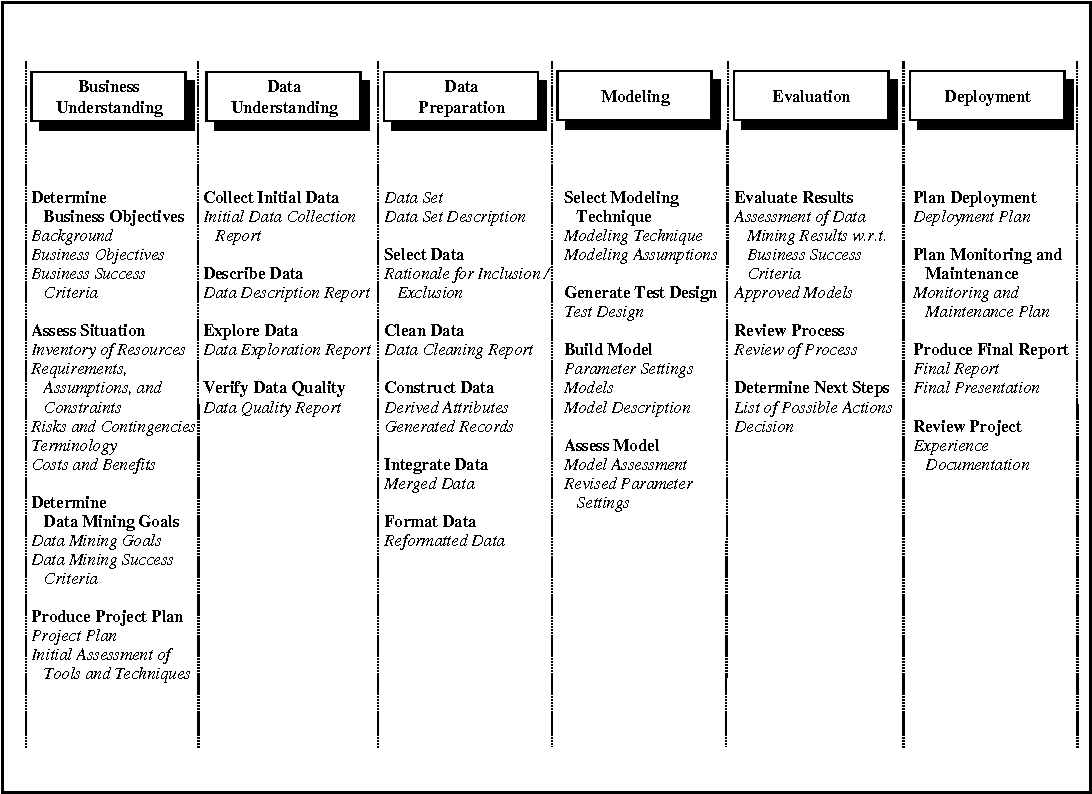
Data-driven projects differ greatly from software development projects and how they progress. Perhaps the most used model is CRISP-DM (CRoss-Industry Standard Process for Data Mining), which was introduced by Colin Shearer in 2000 in the Journal of Data Warehousing.
The model is an iterative model that is easiest to understand from a single image:
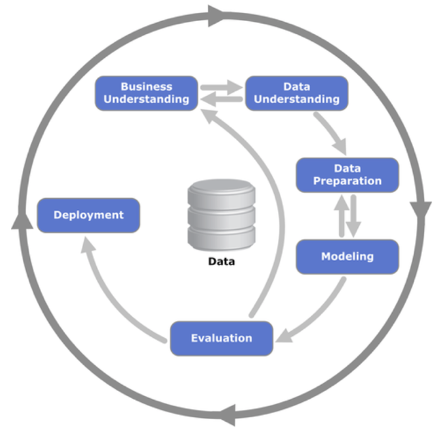
- Business Understanding, or understanding the problem or business that wants to be solved and developed. For example, for this course, the data can be log information from different systems, from which anomalies or deviations from the norm are sought with the help of data analytics.
- Data Understanding, which is understanding the data. What data do we have and in what form. Is the data of sufficient quality? What does the data contain, such as the columns in Excel?
- Data Preparation, which is data preprocessing. Data is rarely in a form that can be used directly. What data is included, data may need to be cleaned, reformatted, enriched with data from an open source, whether variables are combined, the final format of the data, i.e., the form.
- Modeling, which involves choosing a model. Many things affect the choice of model:
- Regression or classification problem
- Supervised or unsupervised learning problem
- What assumptions are used in modeling
- What parameters are used in the model
- etc.
- Evaluation, which is the evaluation of the model. How does the model perform in solving the problem?
- Deployment, which is the implementation. How, in what way, where, and when the model is put into production use.
Data Analytics
Data analytics encompasses various methods and approaches that are united by the aim to form interesting higher-level information and models from data collected in different ways, which in turn enable the making of various useful conclusions.
Generally, data analysis has the following stages:
- Preparation
- Planning
- Data collection
- Data preprocessing
- Cleaning, filtering, complementing, correction
- Outliers
- Missing values
- Data description
- Graphical representations, visualization
- Frequency tables
- Summarization using descriptive statistics (mean, etc.)
- Examining dependencies (correlations, etc.)
- Clustering
- Statistical significance
- The probability with which sample observations are repeated in the population
- Predictive analytics and machine learning
Why Python
The Python programming language is an open-source, free programming language that is flexible, powerful, and relatively easy to learn. Python has powerful data processing libraries that are capable of data cleaning, data analytics, time series analysis, predictive analytics, and machine learning models. The essential Python skills needed for data analysis can be quickly learned even if you do not have prior programming experience, but it does require work. Of course, understanding the basic principles of programming accelerates the adoption of concepts here as well, but Python's syntax is easy. Python is currently one of the most popular programming languages. We will return to Python's syntax a bit later.
Summary
There are graphical ready-made programs for data analysis such as Excel, SPSS, etc. In addition, there are paid programs where data analytics are performed by programming, such as Matlab. Here are a few reasons why you should use Python for data analysis:
- Python covers all areas of data analytics, including machine learning and deep learning
- At the same time, you learn to code
- Python is fast and works with large data sets as well
- Basic tasks are easy to handle and can be learned by using them a few times, for example, the describe() and corr() functions
- Once written, the code can always be executed again, so data with the same structure can be analyzed without rewriting the code, and with small changes, you can utilize the code written once with new data
- Especially in Jupyter Notebook, the written code serves as documentation of the analyses performed. You can make changes to the code at any time and rerun the analyses.
- Python offers excellent visualization libraries for graphical illustration of results
- Python is a general-purpose programming language, and the results calculated with it can be used as input for other programs
- Python is used for a lot of automation, so you can automate data analytics
- There is a plethora of study material and examples on the Internet, so by typing an English question into Google, you usually find an answer as well
- Python works the same way on Windows, Linux, and MacOS operating systems
- Python is supported in almost all cloud services
- Python is free